Optimizing the "quality" of marketing strategies
-- CMM (Consumer Mix Modeling)
compass
A unique CMM analysis platform that mathematically elucidates the "brand choice structure" of consumers.
By understanding the influence of the 4Ps, competitors, and external factors on purchasing behavior, we can improve the "quality" of our strategies through a deeper understanding of consumers.
*Part of the COMPASS technology is currently under patent application.
We are listening to the "voice of the consumer."
Still, why aren't there any results?
Many marketing managers, despite having large amounts of survey data and reports, are unable to answer questions such as "Why did it sell (or not sell)?" and "Which factors most contribute to consumer purchasing behavior?"
Customers' true feelings and purchasing motivations are not visible.
"Contradictions between interview statements and actions," "High survey scores but stagnant sales"—these are examples of companies failing to grasp the "unconscious" purchasing motivations that customers themselves cannot articulate.
There is a lack of evidence to support the "certainty" of the strategy.
"The direction is determined by rules of thumb and subjective interpretations," and "There are hypotheses, but there is no objective evidence to determine if they are truly the 'best move'," making it impossible to formulate highly reliable strategies.
The "criteria for decision-making" regarding policies are vague, leading to a decrease in accuracy.
The strategy is poorly supported, instructions to the company and agencies are abstract, and there is no common understanding among the parties involved. Judgments about the quality of the output become unclear, leading to a decline in the quality of execution.
We will use statistics to explain "why it was chosen."
Quantifying customers' true feelings and identifying the next step to increase sales
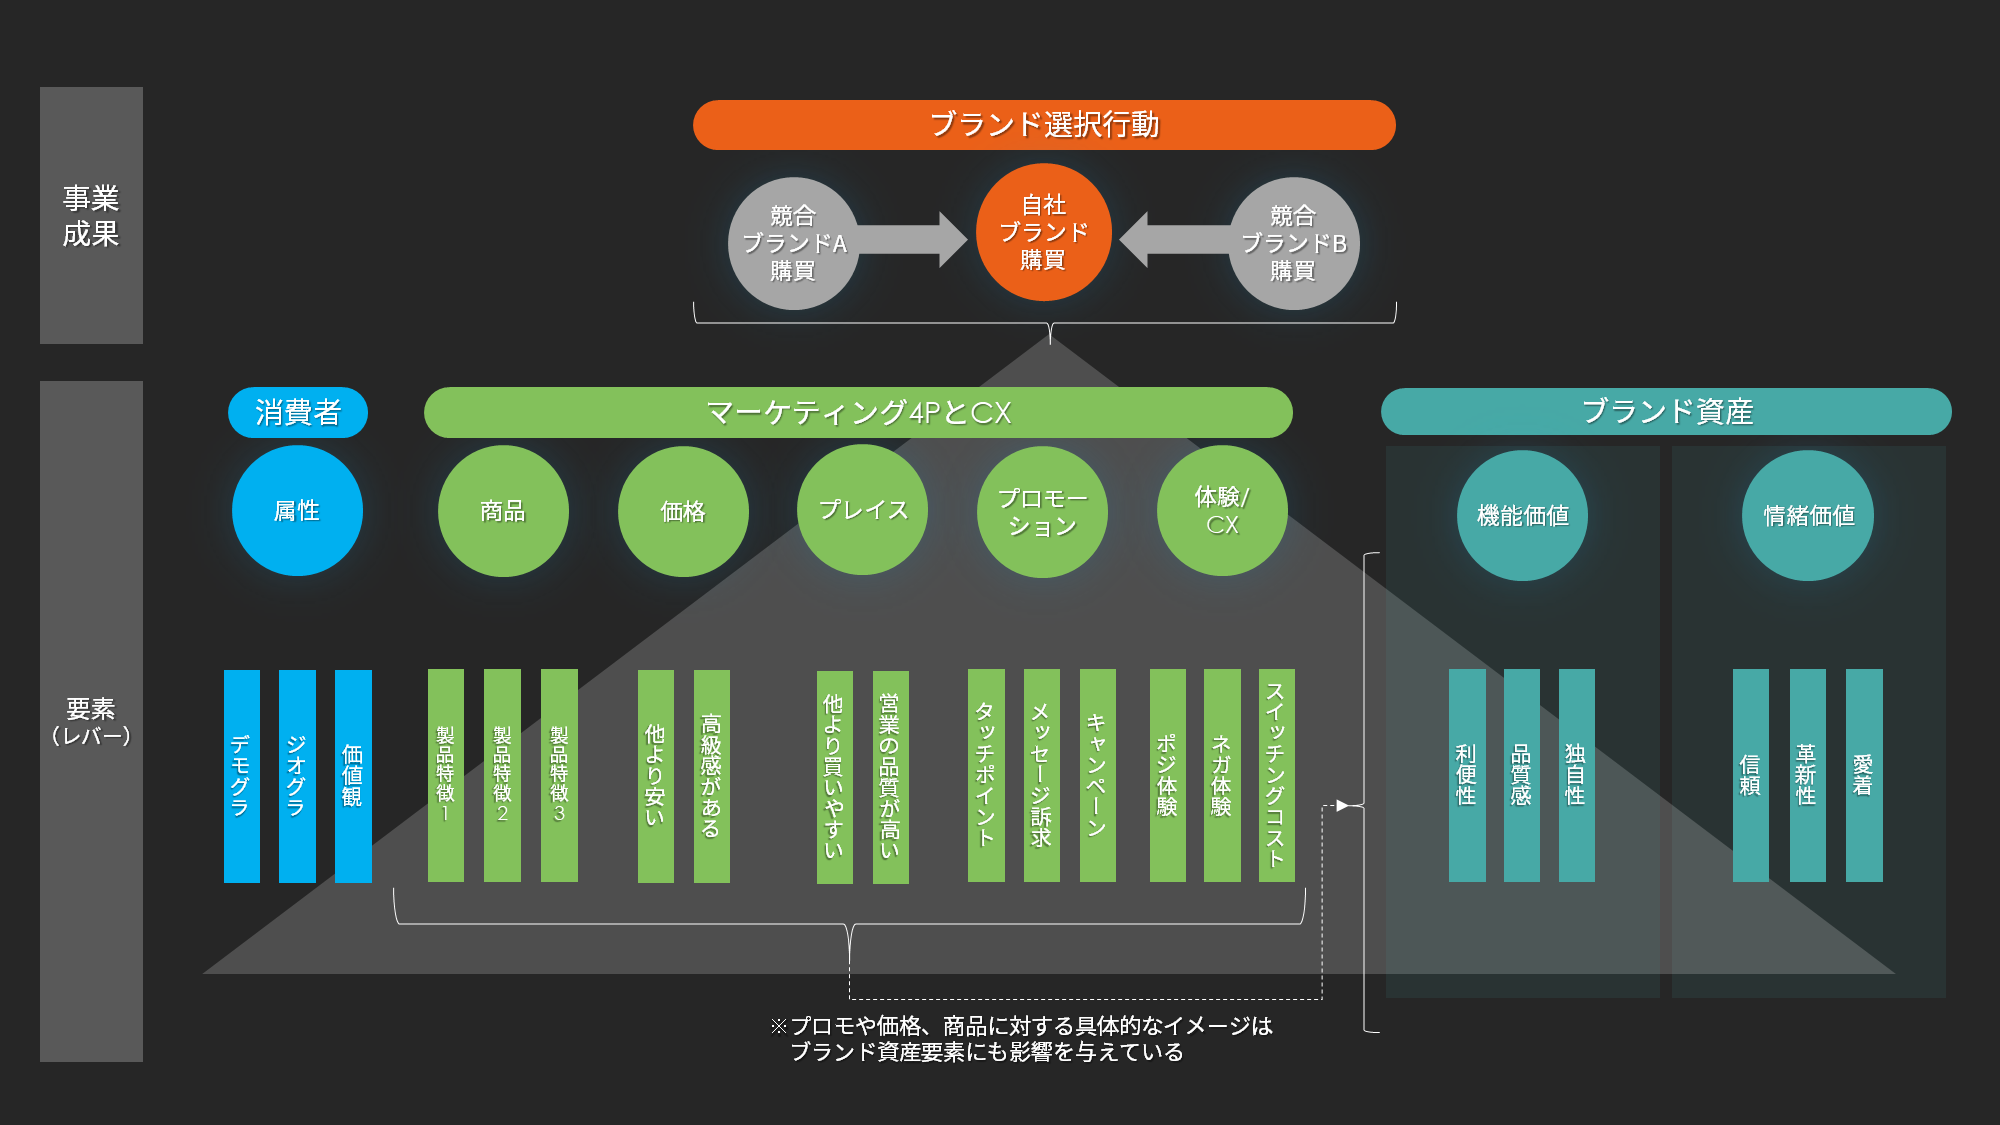
COMPASS is an analytical consulting firm that uses its proprietary CMM (Consumer Mix Modeling) analytical platform to unravel the mechanisms of consumer brand choice. We analyze the impact of the 4Ps of marketing, CX, and brand assets on consumer purchasing behavior. Rather than simply compiling data, we use statistical analysis to calculate the probability of switching from competitors and increasing loyalty.
Visualizing customers' "unconscious" purchasing motivations.
High scores do not necessarily lead to purchases. COMPASS quantifies which factors have the greatest impact on brand selection (purchase).
Identify the "who, what, and where" of your strategy
We derive winning patterns by combining target attributes (Who), the message to be conveyed (What), and the optimal touchpoint (Where).
From "intuitive discussions" to "data-driven agreements"
Objective evidence based on statistical models becomes the "common language" in internal meetings and agent briefings, enabling quick decision-making and reliable execution.
*Part of the COMPASS technology is currently under patent application.

At the forefront of marketing strategy formulation
— Unraveling the Brand Selection Mechanism with "CMM"
This presentation will explain CMM, an analytical method that statistically analyzes the mechanisms of consumer brand selection, enabling the design of effective strategies. We will explore how CMM can delve deeper into consumer insights that traditional surveys fail to capture, and translate them into concrete marketing strategies. We will provide a detailed explanation, including examples from restaurant chains.
Download NowTwo analytical approaches to choose from depending on the issue
"Reasons for being chosen" and "Reasons for being continuously chosen"—we support strategy formulation with two approaches tailored to your objectives.
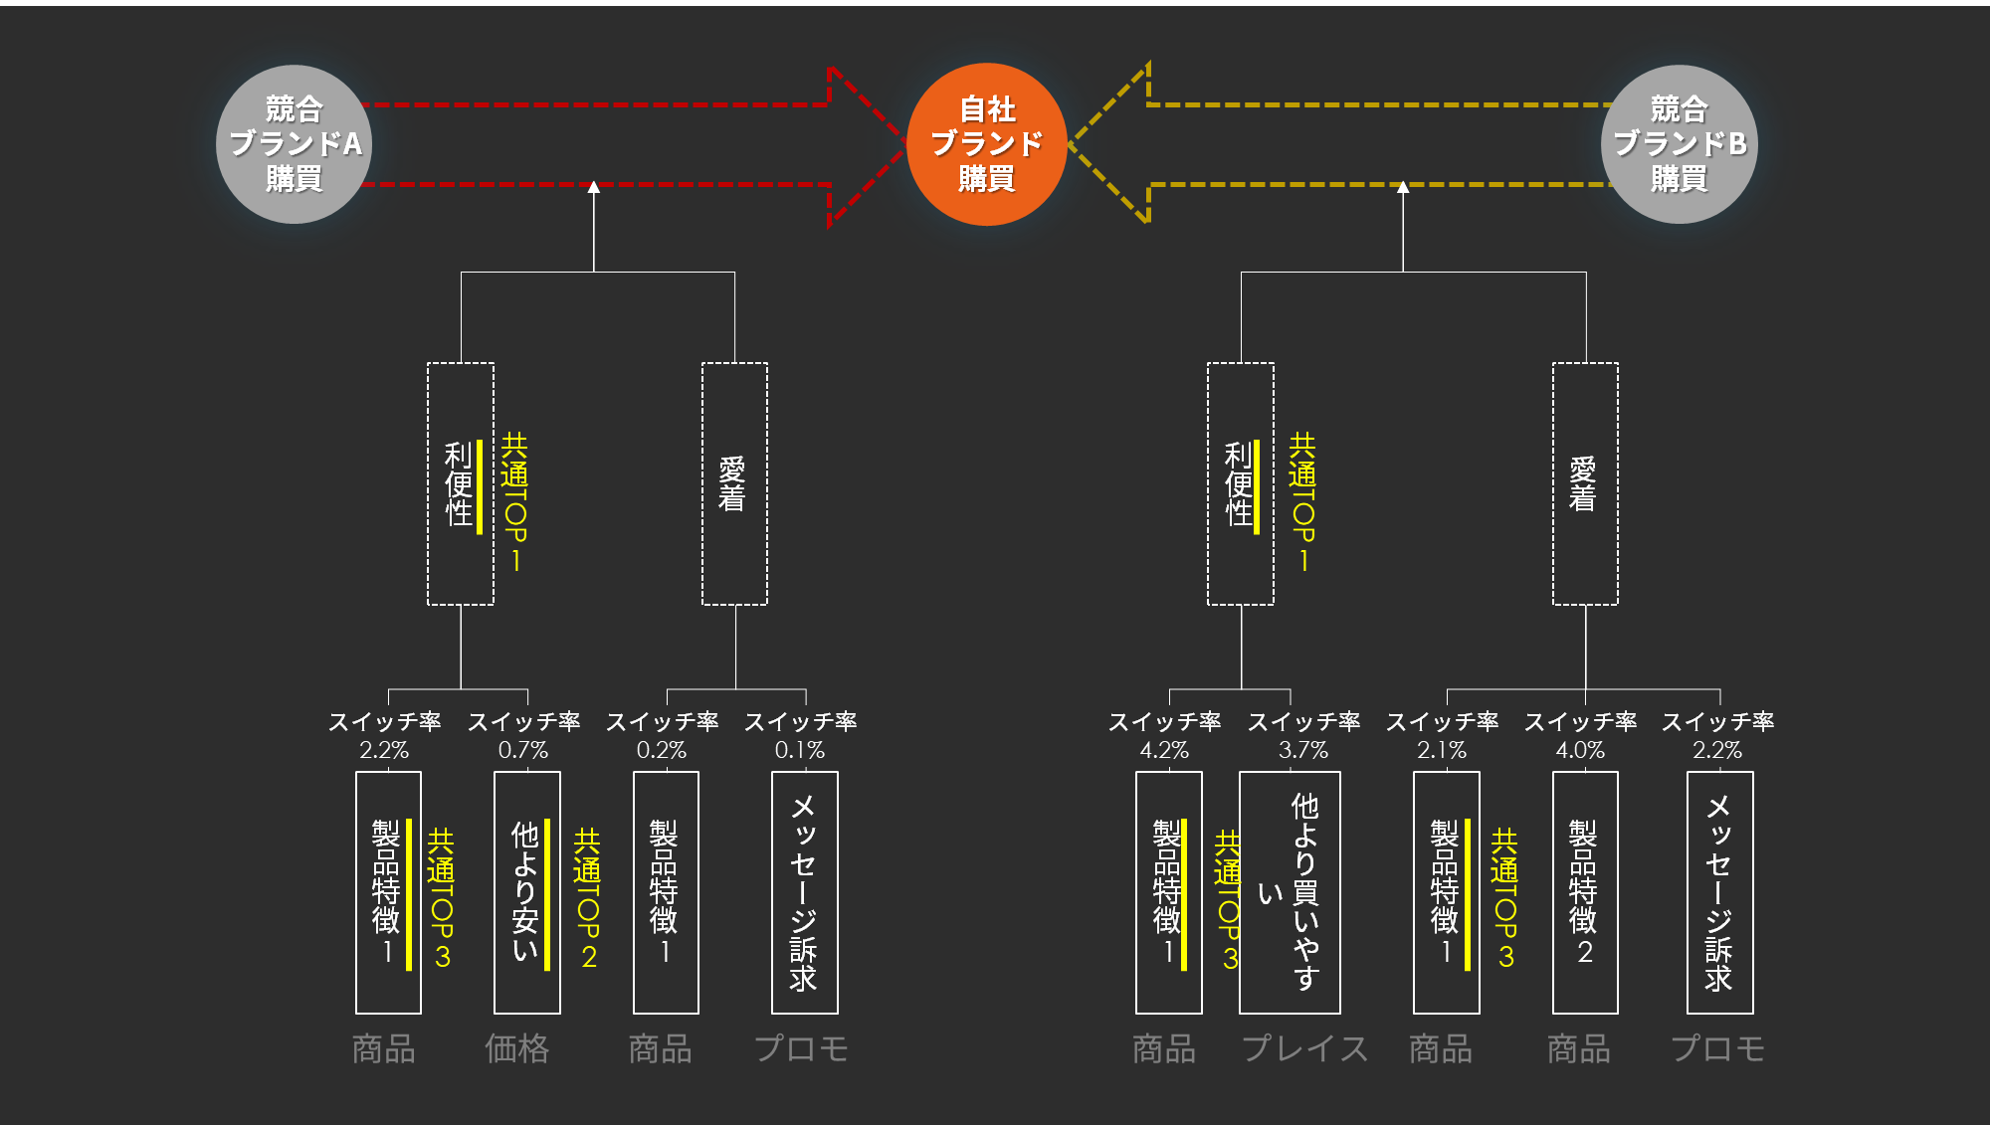
Analysis of the mechanism of "brand choice" among competitors:
Brand Switch Analysis
Identify the key factors that will persuade customers to switch from your competitors' products to your brand.
Analysis PerspectiveAnalyze which elements of each competitor need to be strengthened to maximize the likelihood of switching to your company
Suggestions gainedIt is possible to perform simulations such as "If the score is increased by one point, the market share will increase by a certain percentage," and to derive specific measures to seize market share.
Analysis of your company's "loyalty" mechanism:
Loyalty Driver Analysis
We will develop "light users" into "medium/heavy users" and clarify the loyalty factors to prevent them from leaving.
Analysis PerspectiveAnalyze not only behavior but also what forms the psychological loyalty behind it
Suggestions gainedIt is possible to conduct simulations such as "What percentage of customers will become loyal if the score is increased by one point?", and to design measures to improve LTV.
Common pitfalls with traditional surveys

In general surveys, a higher score than the average or competitors is considered a good score, but this does not necessarily mean that the brand will be chosen more often.
Although it provides an understanding of the current situation for each item's score, it is often difficult to translate it into actionable information, such as the impact of improvement or predictions based on that information.
Even if the degree of impact is considered using a statistical approach, it is difficult to take into account the heterogeneity of respondents, and the results tend to be weak as suggestions for specific actions.
CMM Consulting Process and Analysis Flow
From hypothesis design to simulation, data scientists and consultants will accompany you and guide you to success in sure steps.
Strategic planning and hypothesis discussion
We clarify the target audience and segments and decide which demographic to approach. We analyze and design after sorting out your company's current marketing situation and issues, such as your competitors' market share and your company's loyalty status.
Data acquisition and analysis
We design surveys to structurally and numerically grasp the driver elements for increasing "switches" and "loyalty," collect asking data, and then perform analysis.
Model building and simulation
We will construct a consumer behavior model and simulate the switch rate. Through this simulation, we will quantitatively evaluate how much each factor influences consumers' brand choices.
An example of CMM analysis output Patent pending
We convert complex consumer psychology into "numbers" and "structures" that can be used for decision-making and present them to you.
Identify numerically what you need to focus on to win
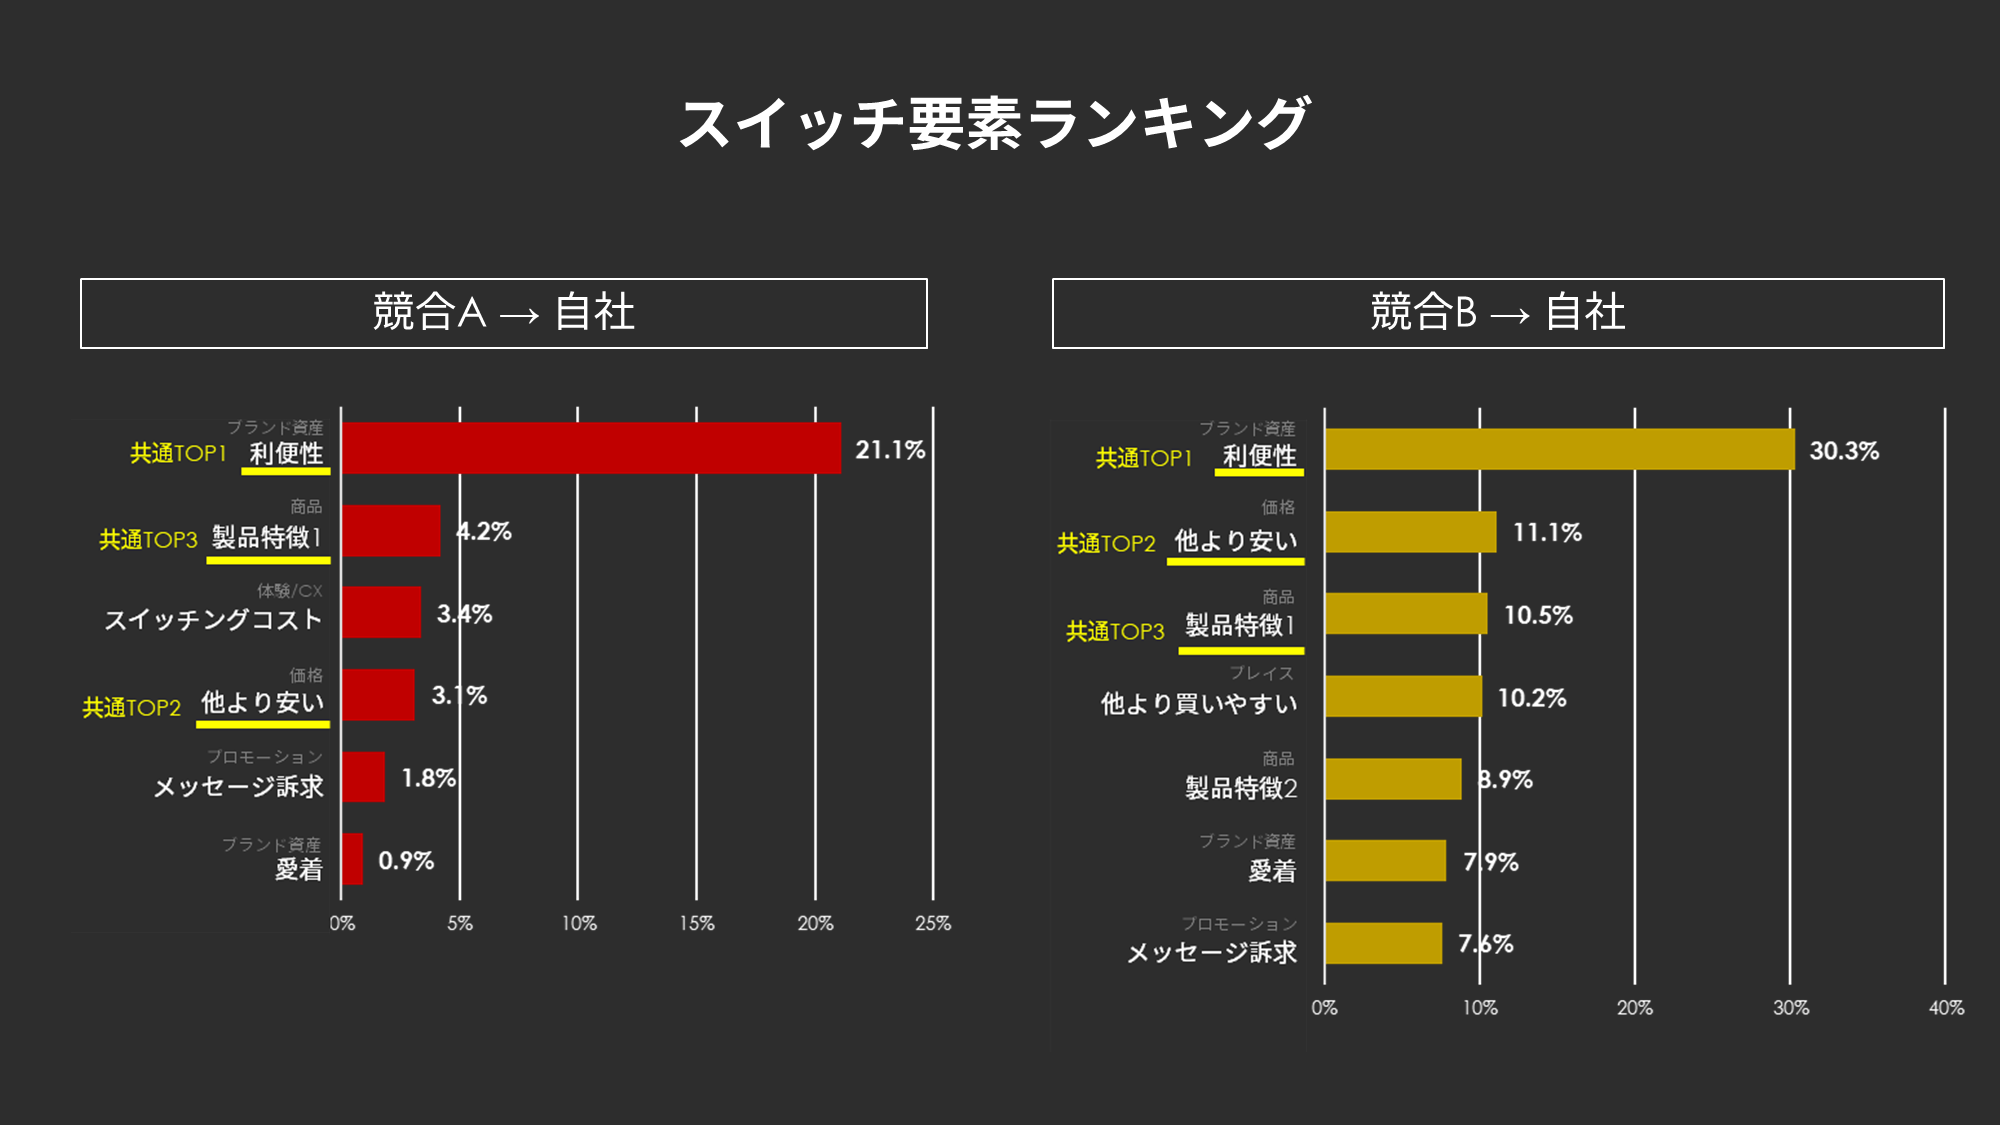
We visualize in a ranking format which elements (4P, CX, brand image) are most effective in switching customers from competitors/converting them into loyal customers.
This is the point
- Calculating the "switch rate*" makes priorities clear
- Identify the differences in effective "attack methods" against competitors A and B (Brand Switch Analysis)
*Switch rate: The percentage of people who switch/loyal when their survey response score increases by 1 point
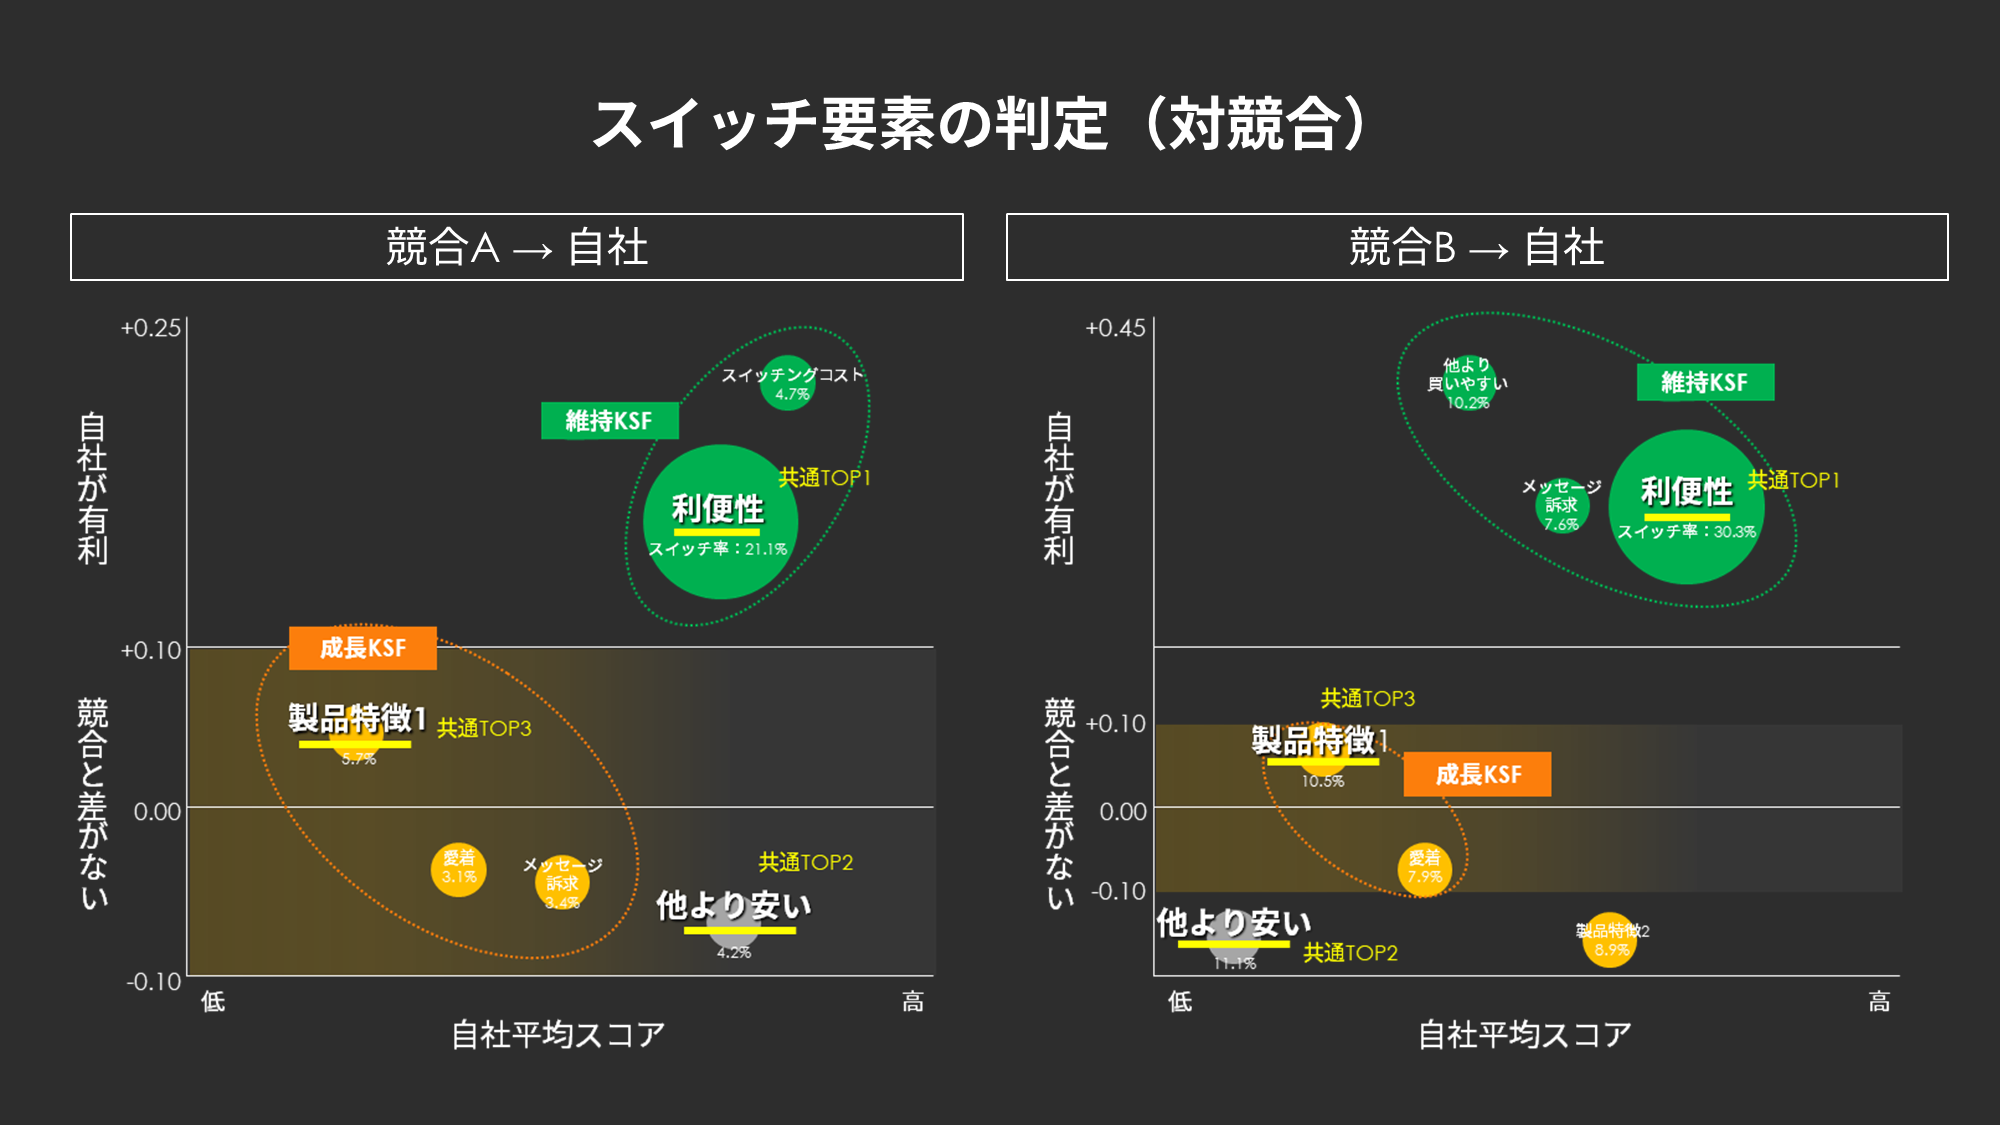
Organizing "strengths to maintain" and "opportunities to exploit"
Plot elements on two axes: "your company's evaluation score" and "difference with competitors." This clarifies the "maintenance elements (critical success factors)" where you are already winning, and the "growth elements" where you are competing closely.
This is the point
- At a glance, you can see where you should focus your investment resources
- Avoid inefficient investments (which have already won or have little impact)
Clarifying the structure of brand choice
We identify not only the direct impact on consumer behavior, but also the "indirect effect" via a specific brand image, and structurally clarify which measures contribute to building brand assets.
This is the point
- Identify the specific experiences and messages needed to increase brand loyalty and trust
- The entire mechanism of measures → change in attitude → purchasing behavior can be quantified.
Identify your selling points to beat your competitors
- Data-driven strategy that connects analysis to the next step
Addressing the challenge of "competitive analysis not leading to action," this presentation explains a methodology for identifying winning "selling points" based on data. It will cover how to calculate the probability of consumers switching from competitors (switch rate) and how to develop strategies to maximize return on investment. A practical framework will be presented, including examples from consumer goods manufacturers.
Download Now